When talking about where we need to go next in the housing industry, it's important to look at where we are currently and what our trajectory is. This will help us determine the needs of our current and future communities and what we can do to help them. To do this, let's look at 12 housing statistics.
Housing Statistics for the United States:
1). “In 2022, about 29% of all US households were one-person households
As our one-person households increase globally, we are no longer needing as many large single-family residences, rather we are needing more multi-family and middle housing options.
2). By 2030 1 in 5 Americans will be 65+.
With our aging population, there is an increasing need for smaller and more affordable homes for the older population to live in that cannot afford to live in large single-family residences. This also means that the housing being built should consider universal design methods to make the homes accessible to folks using mobility aids and with various disabilities.
3). By 2025 up to 85% of households will not have children.
A staggering number to look at! Regardless of why people are choosing not to have children these days, it means the population does not need as big of homes to house a family of 3+ anymore. The needs and priorities of our population are rapidly changing, so our housing needs to reflect that.
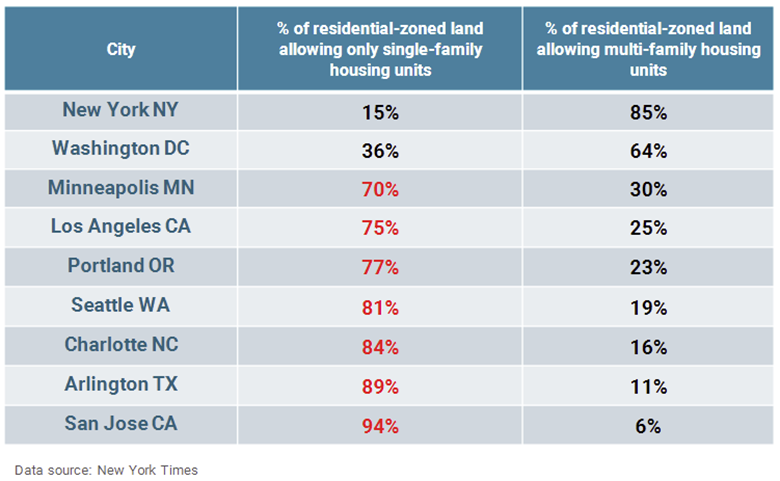
4). As much as 80% or more of many cities is zoned exclusively for Single Family.
And yet the laws are still lagging behind and only allowing single-family residences to be built. An overhaul of the legislature is greatly need in order to legalize multi-family/middle housing.
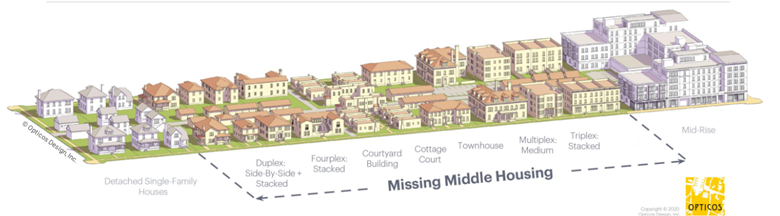
5). Millennials are looking for walkable living and MMH (missing middle housing).
Studies even show that this generation of renters and home buyers aren't looking for the traditional single-family home. They are wanting middle housing and housing in communities that are walkable--where they can walk to the grocery store, a park, a restaurant, the gym. But the zoning across most US cities doesn't allow for this.
Housing Statistics for Bellingham & Whatcom County:
6). Bellingham is expected to have an average population growth of 1,350 people per year in the next 20 yrs.
This may not seem like a lot, but when you think about the fact that our population is currently at just over 93k people and the vacancy rate is just under 2% (we are in need of more housing already), then the reality of the amount of housing we need to build in the next 20 years to not just keep up with the growth, but also make up for the lack of availability already.
7). The median income for Bellingham is around $60,000/yr.
This means that 50% of Bellingham residents make $60k/yr or less and the other 50% of residents make $60k/yr or more. This becomes more important when knowing the following facts.
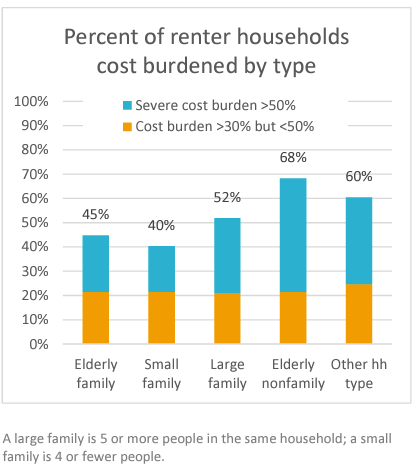
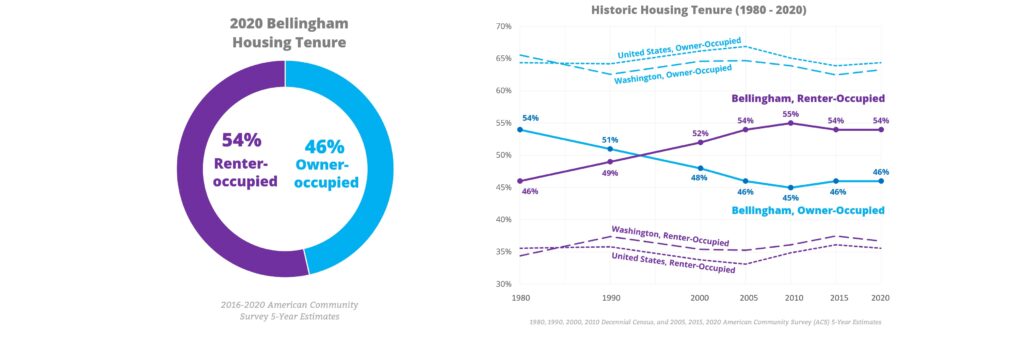
8). “In Bellingham, 24% of homeowners and 56% of renters are cost burdened.”
If 54% of renters are cost burdened just renting, then that means the likelihood for more than half of our renters to be able to purchase a home is incredibly low. But homeownership is the best way to gain equity. So more than half of renters are stuck in the perpetual cost burdened cycle until something changes that makes housing more affordable or they are somehow able to make enough to purchase a home. But looking at the following facts, you'll see that's even harder than in sounds.
9). “In the second quarter of 2019, the homeownership rates for white, Black, and Latino households were 73.1 percent, 40.6 percent, and 46.6 percent respectively – the largest differentials in fifty years.”
It's important to note that of those that own homes in Whatcom County, it is mostly white individuals, leaving minorities stuck renting or houseless. Showing that while the issue of housing affordability is affects everyone, it disproportionally affects minorities.
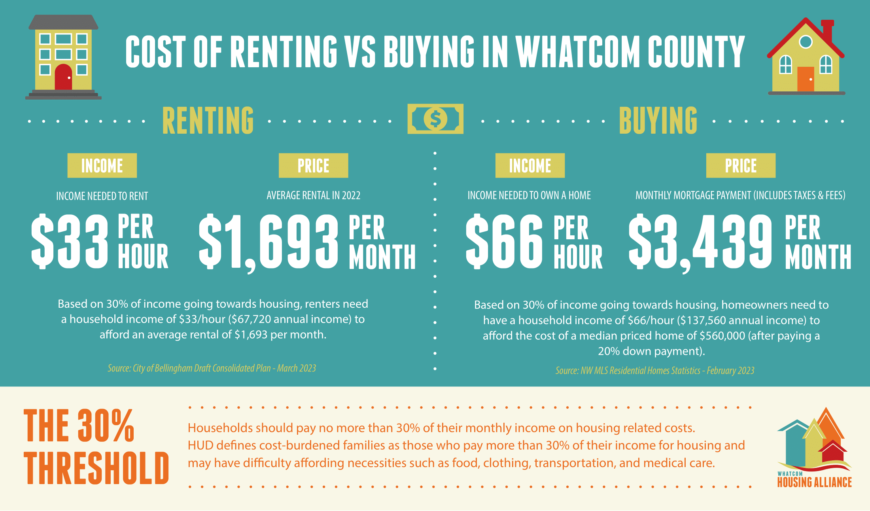
10). In 2022, the average rental cost was $1,693/mo; In order to afford this, a renter would need to make $33/hr or $67,720/yr. (WHA Cost of Renting Vs Buying in Whatcom County
According to 2020 Census data, 71% of Bellingham households are made up of only 1-2 people. Looking back at the median income for Bellingham (which is $60k/yr), we can see that the average rental is not affordable for a huge portion of our community and it shows why 56% of renters are cost burdened.
11). The average mortgage payment is $3,439/mo; In order to afford this, a homeowner would need to make $66/hr or $137,560/yr. (WHA Cost of Renting Vs Buying in Whatcom County)
We saw that 24% of homeowners are cost burdened, and its more shocking that more aren't cost burdened when looking at the average mortgage payment and knowing only 50% of the community makes $60k or more. Even in a household of two making the median income wouldn't be able to afford the average mortgage payment.
12). The median home price in Whatcom County in February 2023 was $560,000; However, a couple making a collective $100,000/yr could only afford a house worth $385,000. (WHA What is Workforce Housing?)
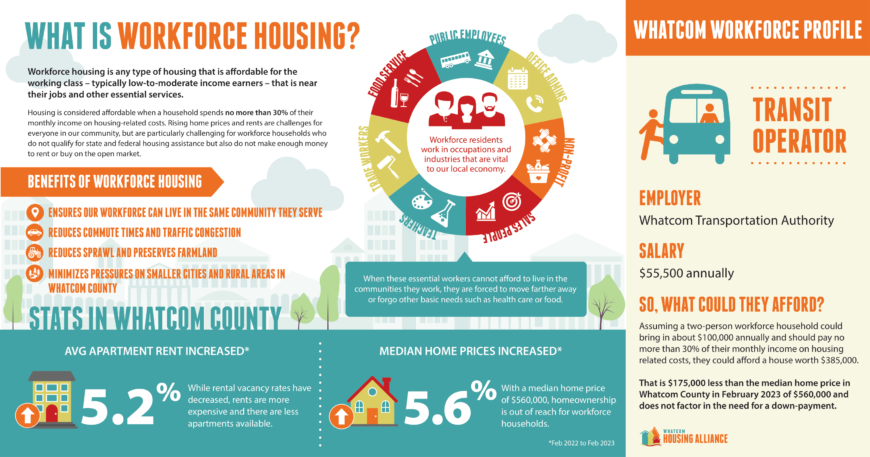
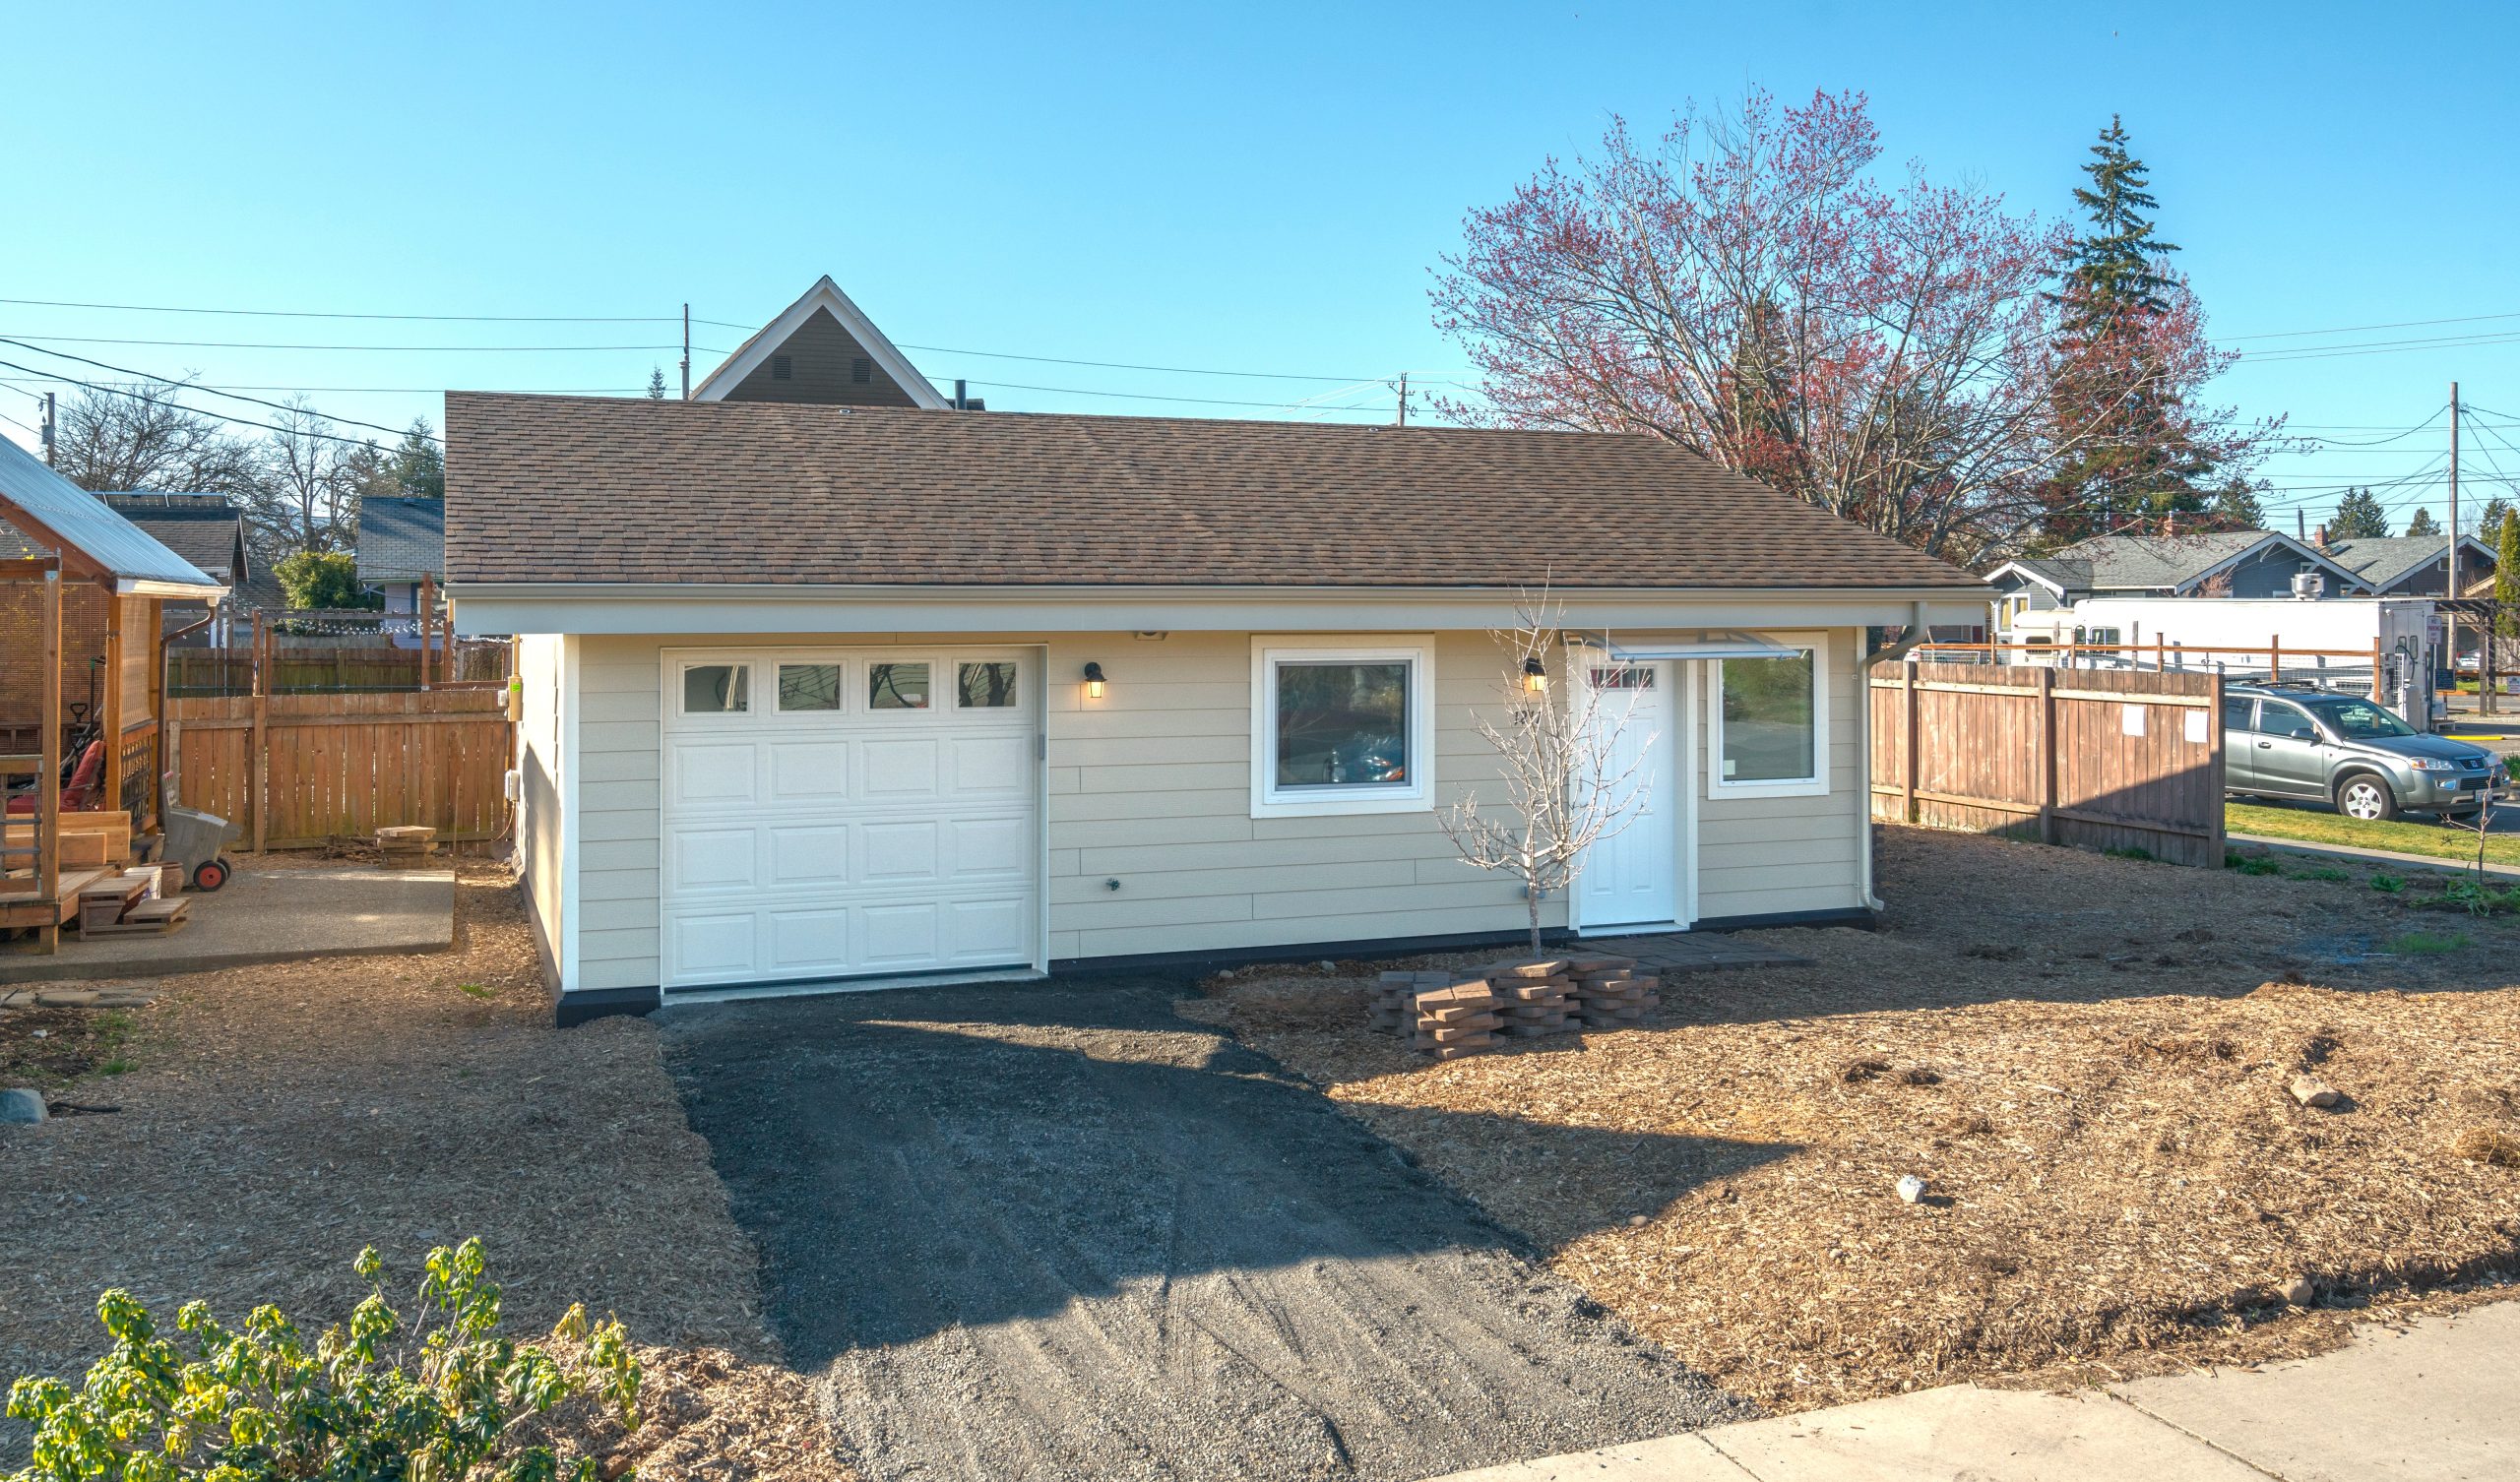
In order for housing prices to reduce to a level that the typical Bellingham or Whatcom County resident can afford, we need to focus on building middle housing which is smaller and more affordable. It also allows us to build more units with more density, which will help address the vacancy rates and growing population. Middle housing is a great option for our aging population as well, as they can still live in the city where there are public facilities, and it is less expensive. Middle housing will also cater to our changing population dynamics as we see more and more childless and one-person households.
Thankfully Washington state recently passed HB 1110 which legalizes middle housing and HB 1337 which makes it eases the restrictions on ADU's. The city of Bellingham is also working hard to implement these at city-level for our near future.
As housing-for-everyone advocates, TC Legend Homes and Powerhouse Designs strives to educate the public on these important issues while providing healthy, net-zero, carbon neutral budget homes in an effort to not only help the housing crisis, but provide top-performing homes.
To further discuss middle housing and the path forward for our community, or to get started on your very own project, contact us today!