Case Study & 2024 HIA Winner: The Lynden Powerhouse
July 8, 2024
Written by: Talia Dreicer, Nicole Miller & Senna Scott
The Lynden Powerhouse Case Study, written by Talia Dreicer, was featured in this season’s Master Builders Association Publication!
“The Lynden Powerhouse is a highly efficient, net-positive energy home that cultivates meaningful aging-in-place living and community connections in Lynden, Washington. Designed by Powerhouse Designs and built by TC Legend Homes, this 5-bedroom, 4.5-bath home features three distinct living areas and seamlessly merges innovative design techniques, a high-efficiency HVAC system, and automation technology to create a beautiful and comfortable home. Receiving DOE Zero Energy Ready Home, ENERGY STAR, and EPA Indoor airPLUS certifications, along with a Built Green 5-star certification, this home is a shining example of high-performance housing.
In the years leading up to their retirement, Baby Boomer couple Lee Anne Caylor and Bob Edmiston saw two potential paths. According to the couple, the choice was “a decision between lives of generativity or stagnation.” Caylor and Edmiston chose the path of generativity, focusing on creating a future where they could share time and knowledge with family, friends, and community. They started envisioning their future home, the Lynden Powerhouse, as an accessible, comfortable, and healthy living environment that would enable meaningful intergenerational living and support human connection. The COVID-19 pandemic only furthered their interest in positively impacting the lives of their family, community, and the planet, helping them refocus from their professional goals towards providing solicitude for both younger and older family members alike. The couple also saw the Lynden Powerhouse as a chance to push the high-performance housing envelope. Edmiston, a self-described “mad scientist” with a technical background and keen mind for understanding how things work, wanted to incorporate automation technology and add resiliency measures to optimize resources and reduce future financial burdens. Seeking a team that could deliver on their project goals, Caylor and Edmiston approached Powerhouse Designs and TC Legend Homes to design and build the Lynden Powerhouse.”
Additionally, we were excited to hear this week that Lynden Powerhouse is one of the 2024 DOE Housing Innovation Award winners! We don’t know what category the home has won yet, but we are beyond ecstatic and grateful to be receiving yet another win.
This was truly possible because of the collaboration with our incredible clients who were willing to push the envelope with us. We have the deepest appreciation for them and the innovative smart home features they created!
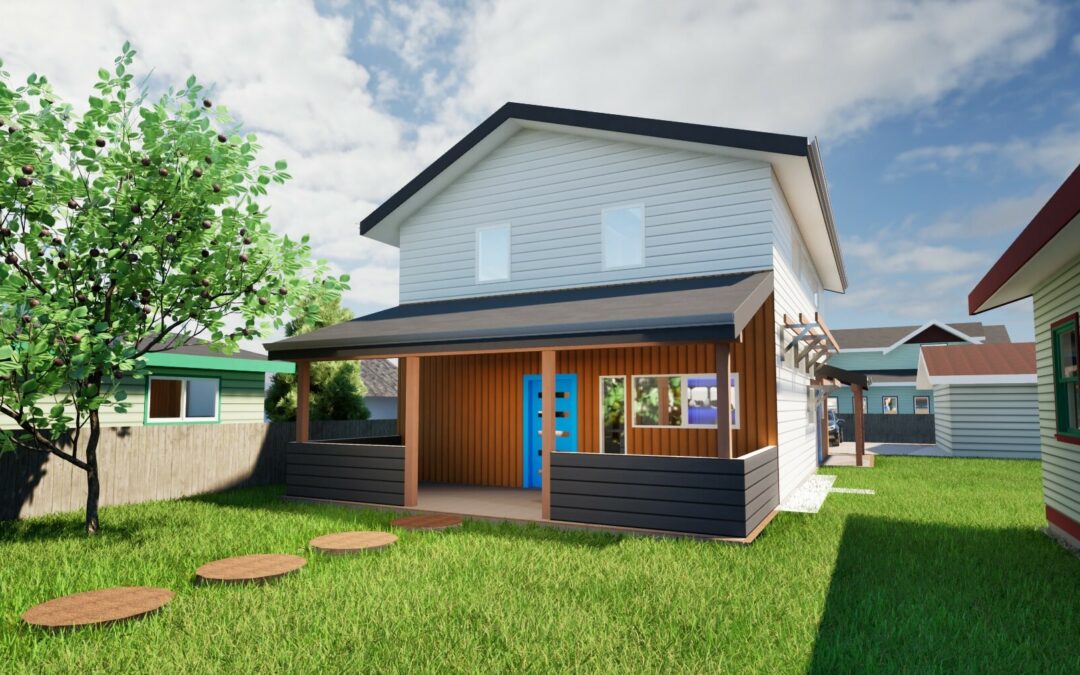
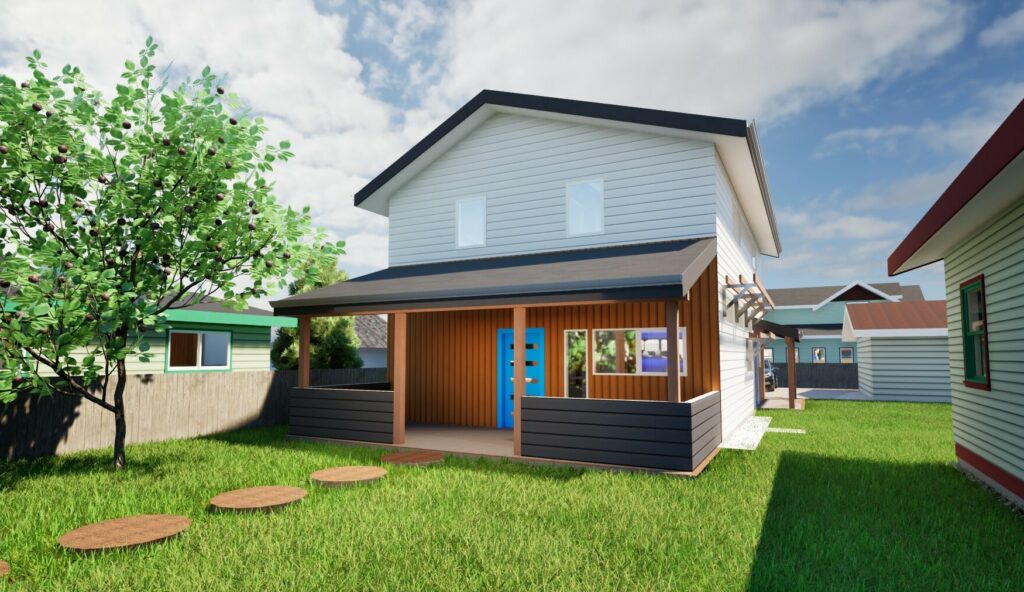
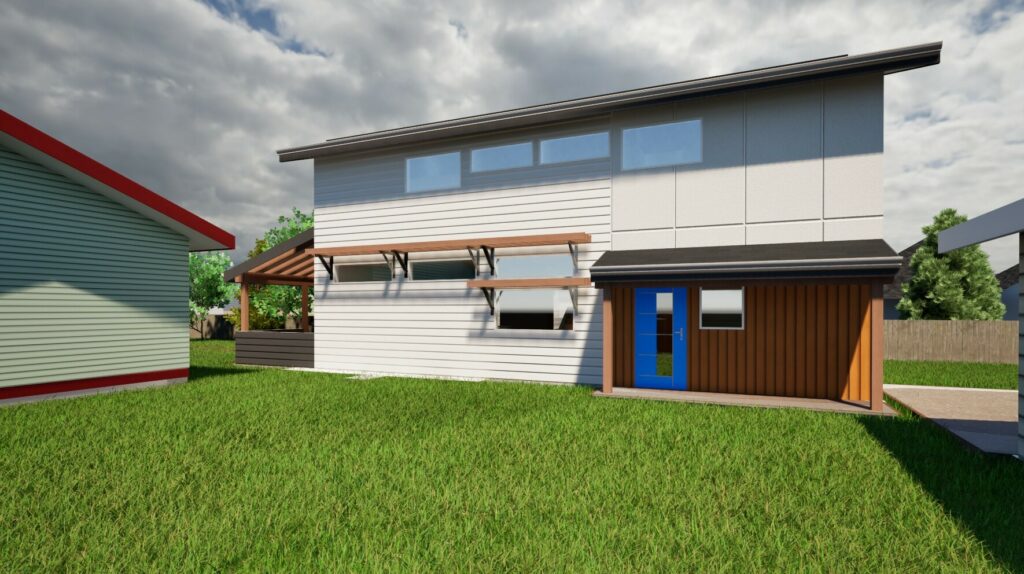
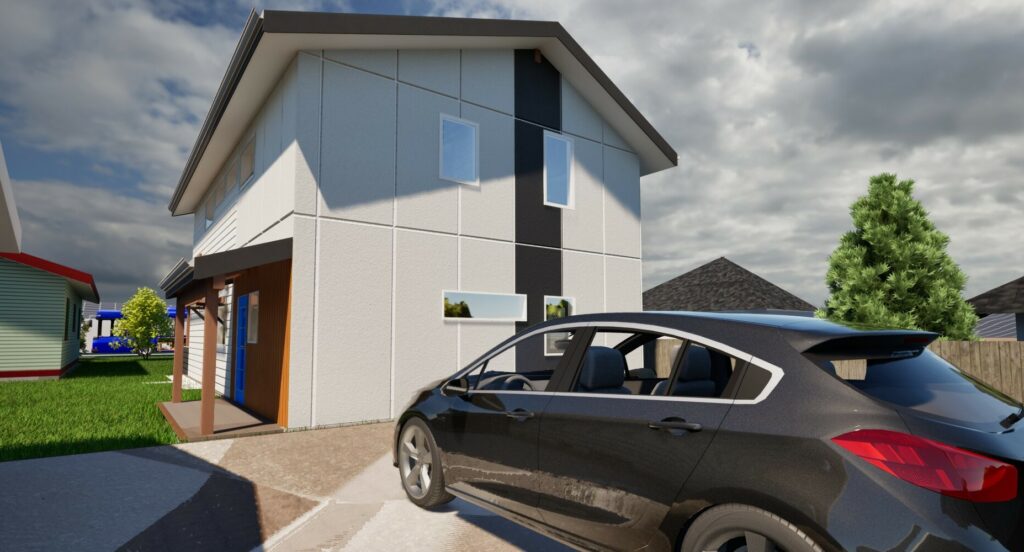
We are excited to announce our Net Zero Energy Co-Housing spec project that’s currently under construction!
Titled “Woburn House” on our social media, this 5-bedroom home is intended to house multiple family units and has an accessible first-floor bedroom and bathroom. Our hope is for this to be a multigeneration home creating a small, tight-knit community.
As always, this home will create its own power, leaving the residents with zero electric bills. We also anticipate it will receive Built Green 5-Star, Indoor AirPlus, EnergyStar, and Zero Energy Ready Home certifications.
Once completed, this home will be open for lease or purchase!
There seems to be a lot of confusion around Structural Insulated Panels (SIPs) in home building. In this article, we will run through the most common questions we’ve seen!
Are SIPs panels non-combustible? / Are SIPs panels fire resistant?
While SIPs can still catch fire, they are less combustible than traditional stick-framed homes. That’s, in part, due to less wood being used and because of the flame retardants used on the foam. In combination with the gypsum drywall, the whole assembly has a 1-hour fire rating. SIPs construction also does not require an attic space, which can be a fire hazard, thereby eliminating a major threat.
How are SIPs panels made?
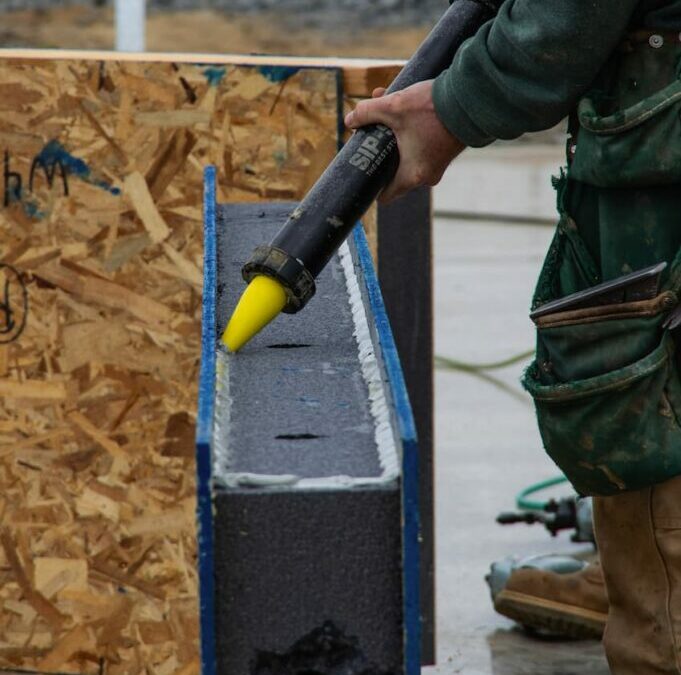
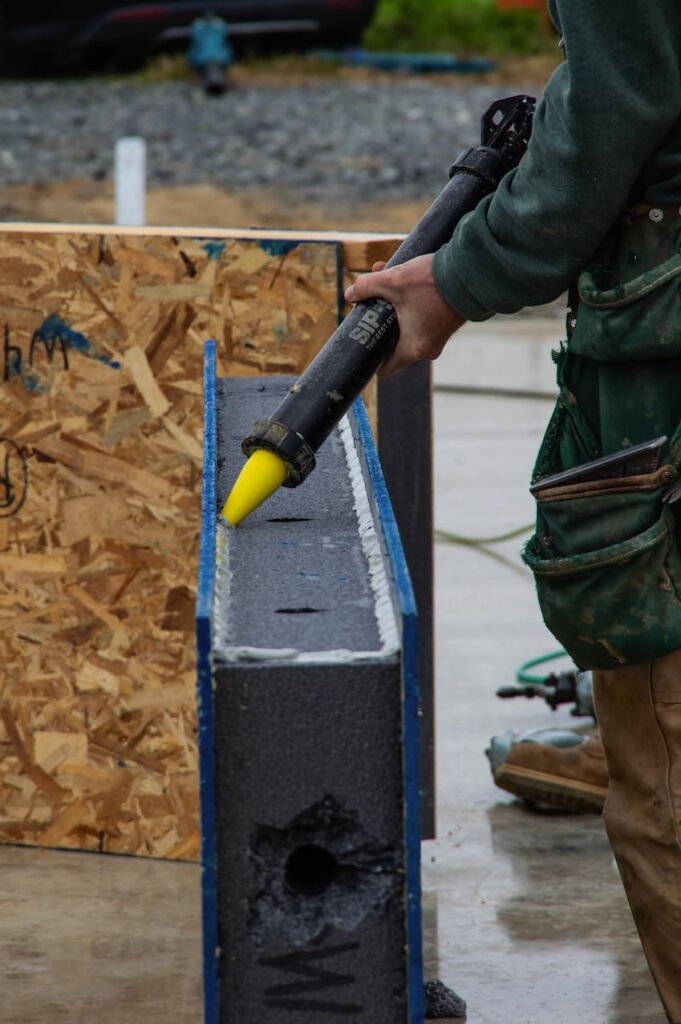
SIPs are manufactured off-site to the exact specs of the house. Each panel is made up of two OSB panels sandwiching an EPS or GPS foam core. During the manufacturing process, workers cut out each window and door opening and cut all of the pieces perfectly to size, so that when they are installed on site, they will fit together perfectly like Legos. This also means that the panel off-cuts can be recycled and reused at the manufacturing plant, reducing the overall waste!
Are SIPs panels load bearing? / Are SIPs panels structural?
Yes! SIPs can be used for the entire exterior shell of a house. According to Insulspan, “SIPs have structural properties similar to that of a steel I-beam.” In fact, SIPs are actually considered more structurally sound than traditional stick-framed homes.
Are SIPs panels environmentally friendly?
Yes! SIPs are generally considered to be more environmentally friendly than traditional stick-framed homes. That being said, SIPs can use either EPS or GPS foam cores and EPS is not a very eco-friendly option. So, it’s best to use GPS SIPs in order to lessen the home’s overall carbon footprint. Also, since SIPs are manufactured off-site, they are made to the specific dimensions of a home which reduces the waste. Any scraps produced during manufacturing are also reused. Furthermore, when shipped, the panels are tightly flat-packed together reducing fuel needed for transportation.
Can SIPs panels get wet?
Yes! SIPs are built to dry out and can withstand exposure to the elements for many months. The foam core doesn’t absorb water unless it’s physically submerged or constantly wet for a long time. In all the years we’ve built using SIPs in the rainy Pacific Northwest, we have never had an issue with the SIPs compromising due to moisture.
How long will a SIPs house last?
SIPs are a super sturdy and hardy building material. Assuming you are properly maintaining your house (i.e. replacing your roof every 30-50 years, fixing any broken siding or trim, fixing leaks as soon as they happen, etc.), then a SIPs house will last 100+ years.
Still have questions? Shoot us an email! We’d be more than happy to answer any questions you have!
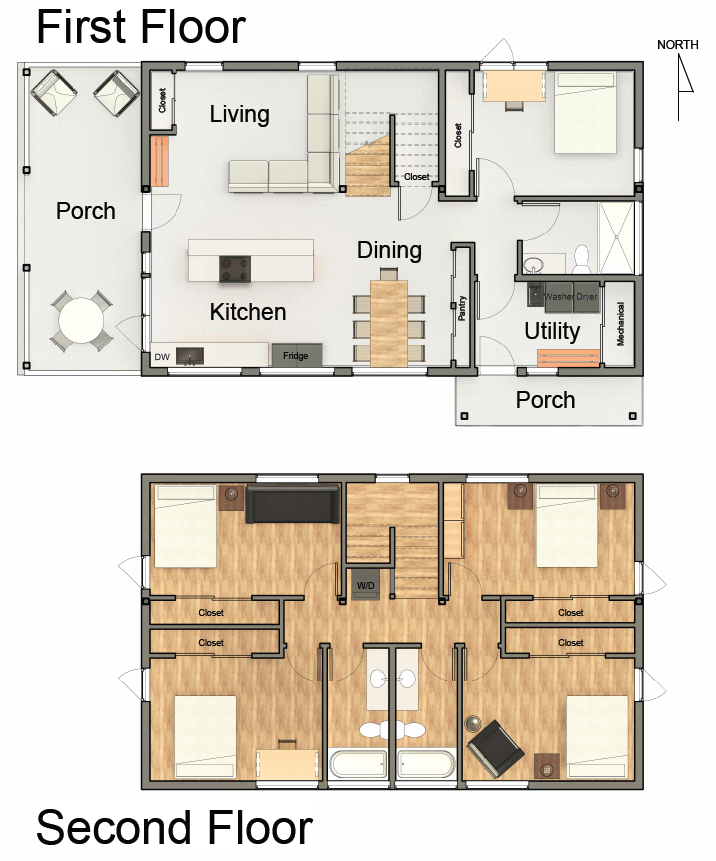
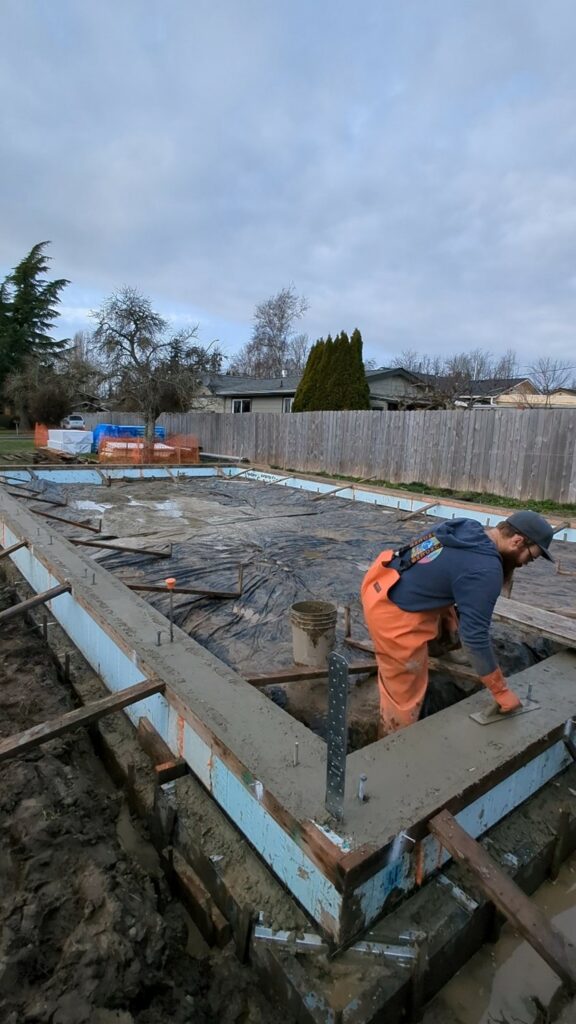
We’ve recently broken ground on our newest spec home. The home will be a total of 2000 square feet, with 5 bedrooms and 3 bathrooms located near Barkley Village.
The intention for this home is to house up to five family units at a time, whether that be through renting or condominiumization.
In order to accommodate this many people there will be two sets of laundry stations, two fridges, plenty of storage options and both a dining room as well as a big bar top seating area. The lower bedroom and bathroom will also be made accessible for anyone with a mobility impairment. We imagine this might be a great living option for older individuals, college students, single-parent families or young couples who want to live in a community-shared space.
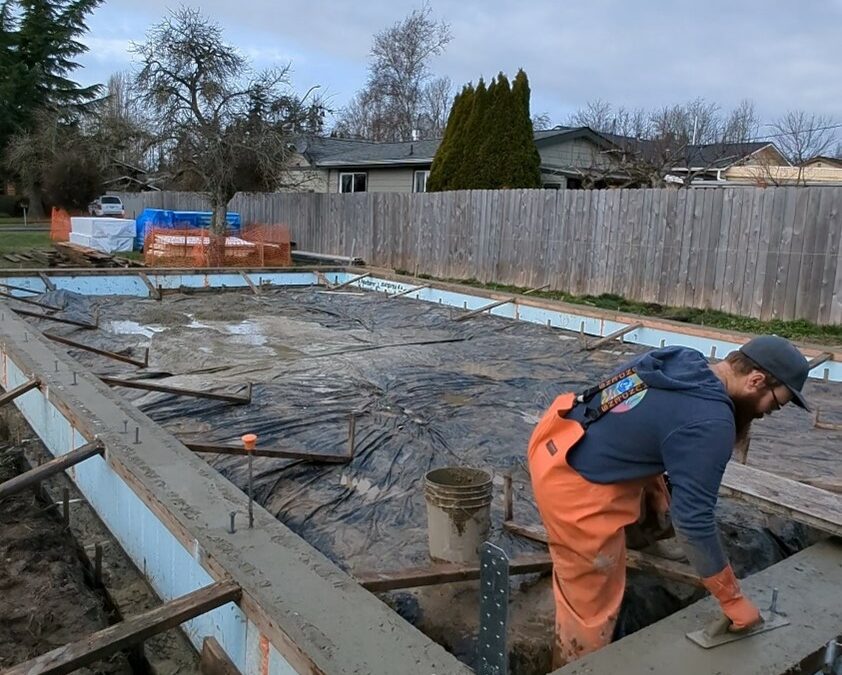
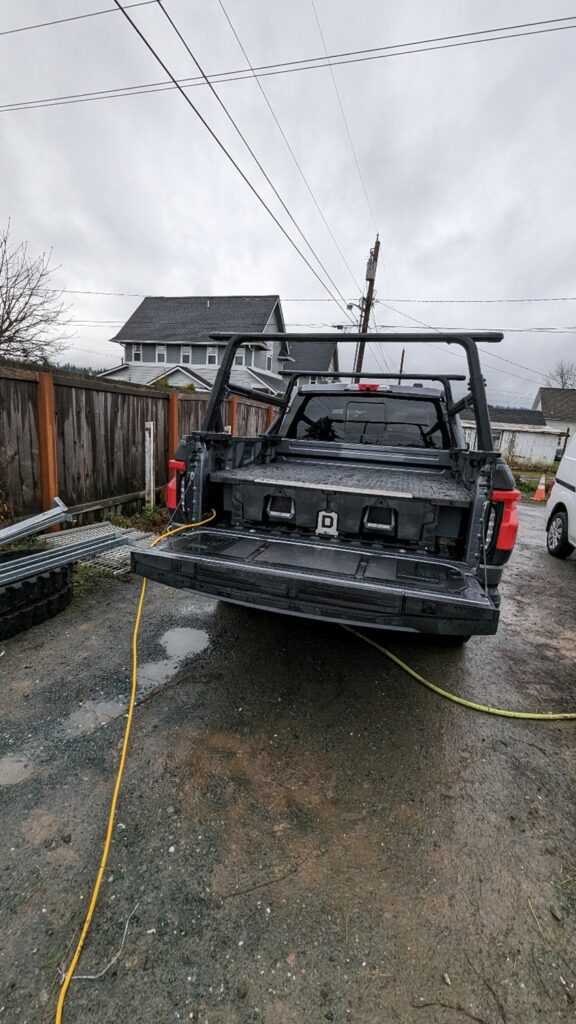
Since we’ve broken ground, we have run into some hurdles in getting temporary power to the site, but with Norm’s new electric Ford F150 truck, the site has been able to be entirely powered straight from his truck.
That means it’s been powering lights and power tools alike! With modern problems, come modern solutions!
To answer why sustainable housing is important, we first have to add context to the question. Each year Washington State adds roughly 35,000 to 43,000 new housing units to the market. However, to keep up with housing demands, we need to be building at least 50,000 new units each year in the state alone. Nationwide, that equates to needing upwards of 3 million new housing units each year. However, the construction industry accounts for a huge portion of the greenhouse gas emissions (GHGs) nationwide and globally accounts for roughly 37% of the CO2 emitted each year. Imagine if we made just a portion of those new homes more sustainable. The amount of CO2 we could save from being emitted into the atmosphere could have a profound impact on the future health of our planet.
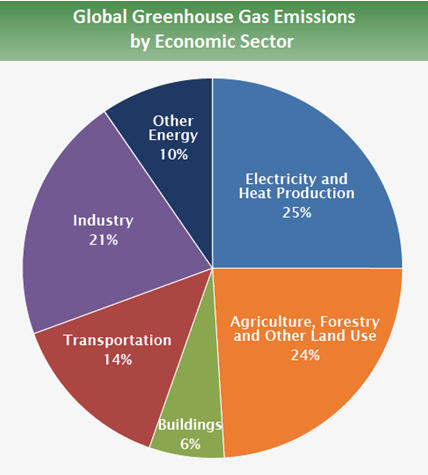
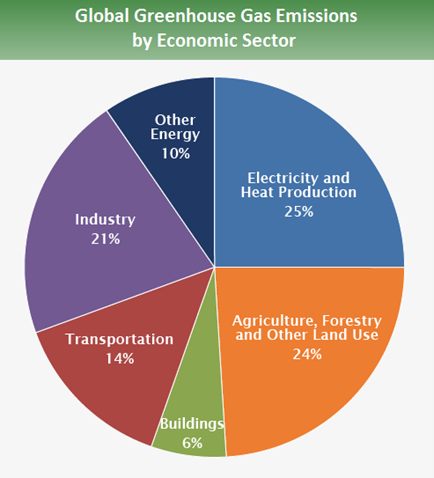
Delving even deeper, there are many different ways the construction industry impacts the overall GHG emissions. As the above chart shows, there’s a sector just for “Buildings,” which consists of the GHG emissions caused by the daily use of buildings such as cooking, heating, waste management, and providing electricity to a building. In construction, we also need to consider the GHG emissions that are produced during the process of building the homes and making all of the materials. That means that, during construction, we are also emitting GHGs from the “Industry,” “Electricity and Heat Production,” “Forestry and Land Use,” and “Transportation” sectors. Altogether, this makes up over a third of all GHG emissions.
In addition to GHG emissions, the production of every material, the deforestation to clear a jobsite, the excavation of a site – all of it has an impact on the environment as well. Deforestation for materials or land removes habitat from the ecosystem, and contributes to erosion which can impact our waterways, as well as impacts the albedo of that plot of land. Producing different materials may require mining out precious metals, minerals, or rocks which has a whole slew of negative impacts on the environment from habitat destruction to the leeching of pollutants into our waterways (think about Flint, MI). Beyond mining, the actual production and delivery of the material takes a lot of energy, produces waste, and can produce a multitude of different pollutants, not just CO2.
If you think about it, every item you choose for your home will have some level of impact on the environment. So, when we talk about sustainable housing, we are thinking about each of these materials and what choices we can make that will lessen our overall impact.
Finally, once a construction project is complete, the building itself will continue to impact the environment. Remember the “building” portion of the pie chart above? When we are building sustainably, we are also thinking about post-construction and how the home will perform sustainably. We want to make the home as energy efficient and water efficient as possible, to lessen those respective environmental impacts after move-in. Of course, the less energy the home is using while occupied, the less GHG will be emitted in order to create that energy. If renewable energy is used to power a home, then that also helps reduce the GHG emitted, but we still want to aim for decreasing the overall energy use since every energy source we use will emit GHGs in some way, some just naturally less than others. We also want to reduce the water consumption of a home while occupied, as clean water is a finite resource, and we are rapidly draining our valuable aquifers and the glaciers that supply our rivers are melting and not returning. Therefore, it’s critical that we reduce our overall water usage.
So, to answer why sustainable housing is important, we have to look at the cumulative impact of the construction industry. Simply speaking, sustainable housing helps us minimize negative environmental impacts from pre- to post-construction, not just to reduce electricity consumption or because of climate change.
At TC Legend Homes and Powerhouse Designs, we are committed to building only net zero energy homes or net zero energy ready homes and are actively working to reduce our home’s overall carbon footprint for a carbon neutral future!
Are you concerned about what the addition of middle housing is going to do to your neighborhood? Are you concerned about it changing the character of the houses, or make your street too busy? Maybe you are all for middle housing but just don’t want it near you. Or maybe you have no idea what middle housing is.
In this article we will explore what middle housing is and what it can look like, along with the impacts it can have on a neighborhood.
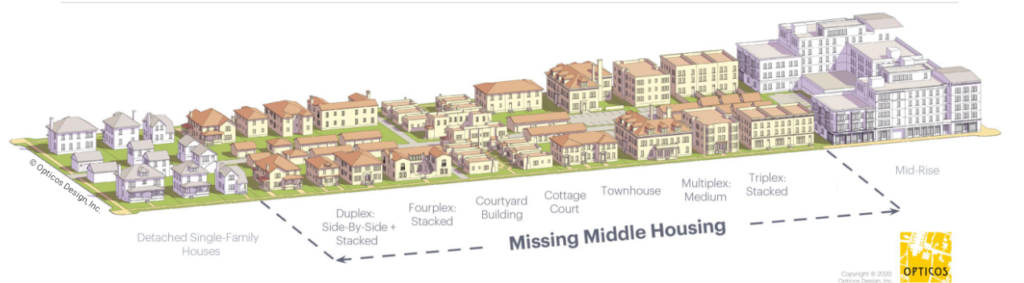
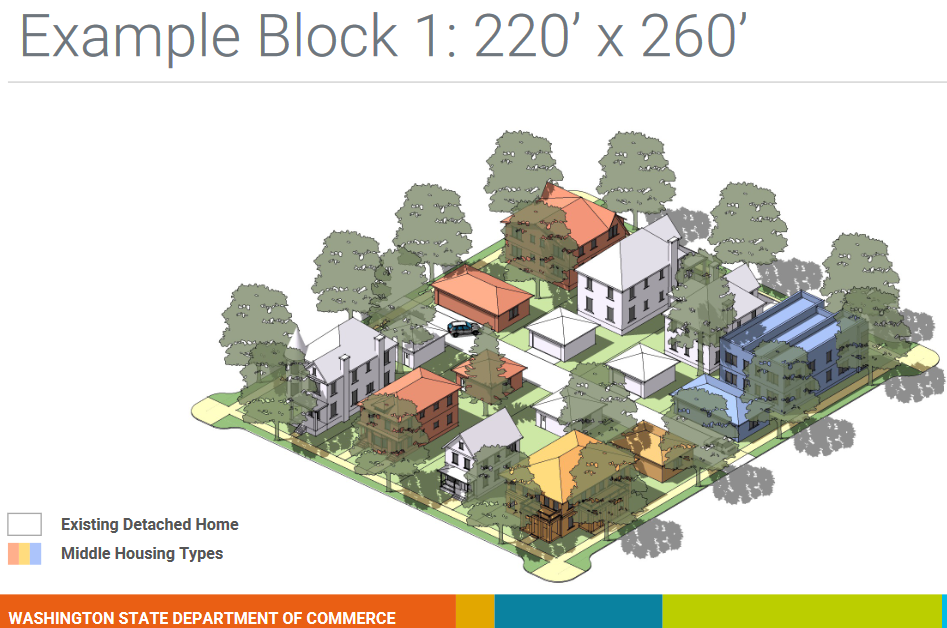
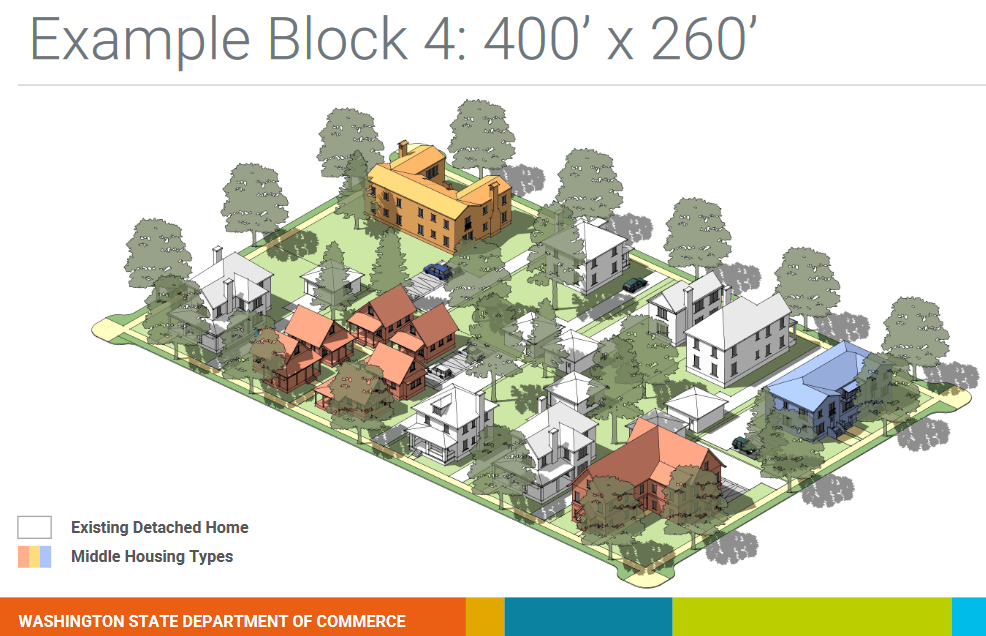
So, what is middle housing anyways? The WA Department of Commerce defines middle housing as “house-scale buildings with multiple units in residential neighborhoods.” That means, any housing structure that is any kind of -plex housing like a duplex or triplex, townhouses, courtyard apartments, cottage homes. “Middle” refers to middle-density housing, as opposed to large apartment complexes which are considered high-density housing, and single-family homes which is considered low-density.
What does middle housing look like?
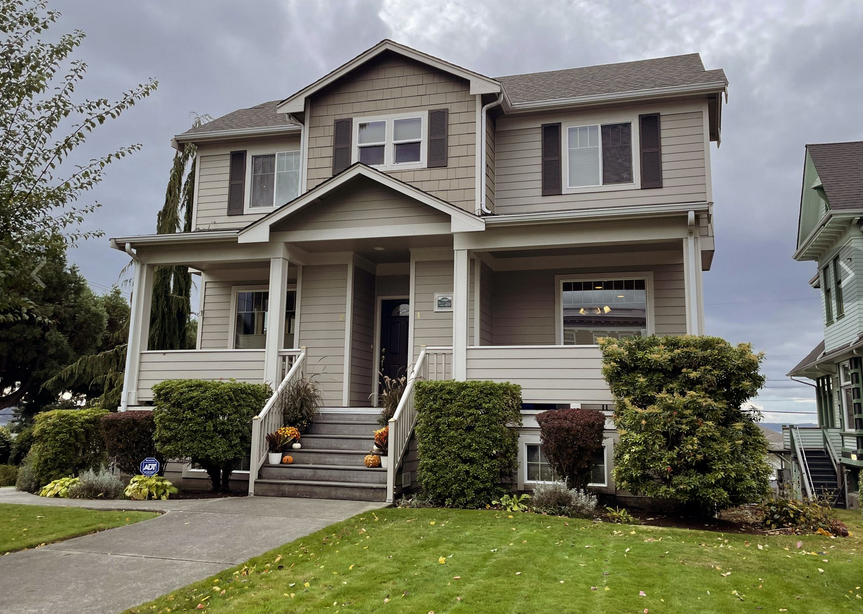
You may still be thinking, “Well, I certainly don’t want a fourplex in my neighborhood! It’s going to stick out like a sore thumb.” Which is an understandable opinion, especially if you’ve only ever seen -plexes that look like your typical apartment complex. But they don’t have to look like that.
With the changing needs of our population, large single-family homes are becoming more and more unnecessary and unaffordable for most people (see our last blog on the statistics). But also we don’t want to tear down beautiful historic homes, or homes that are generally in good condition. So, what about renovating the inside of these preexisting 2000+ square foot homes and splitting them into multiple single- or two-bedroom units, thereby creating a -plex house? It still keeps the same exterior integrity, matching the rest of the neighborhood and you won’t even be able to tell that there are multiple units inside. A scenario like this is also the best case in terms of carbon footprint, because you are utilizing and revitalizing the entire shell and bones of a house.
These inconspicuous -plex housing can be easily built in new construction as well. When you looked at the above photo, did you know that it was six-plex just looking at the exterior?
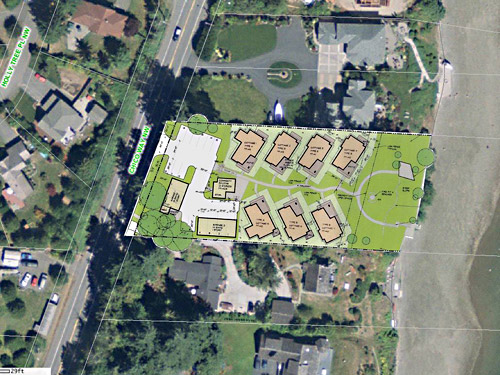
In some areas, lots are already laid out in a way that makes housing options like cottage homes even easier to hide. Take a look at the below cottage community built in Silverdale, Washington. Add some foliage along the perimeter, and you would never know it was hidden on the lot.
Photo Credit: Chico Beach Cottages – Silverdale, WA; The Cottage Company & Wenzlau Architects
Part of what will make middle housing successful is utilizing the correct types for each area. The idea is not to plop a giant multi-plex that looks like an apartment complex in the middle of a quaint neighborhood. That doesn’t make sense for anyone. But it does make sense to put a larger multi-plex on the edge of the neighborhood abut the commercially zoned areas and on busy corners. The point is to put density nearest to the city resources.
Perhaps you’re concerned about more vehicles on the roads in your neighborhood, either parking on the streets or causing traffic?
Summarized by Sightline Institute, as it stands right now, the law “cap[s] mandates at no more than one parking stall per lot on lots 6,000 square feet or smaller, and at no more than two stalls per lot on lots larger than that.” And any middle housing that is within a half-mile of a major transit stop will not be subjected to any parking mandates.
But what does this mean for you? Firstly, the point of creating such high-density housing near commercial areas and transit, is to also reduce the need for individual vehicles. When a community is walk-able and transit is readily available, less people will have cars. We are also seeing more households reducing to only one car instead of two. Take Seattle for example, whose population is ever increasing but their overall car population has remained stable for the past several years.
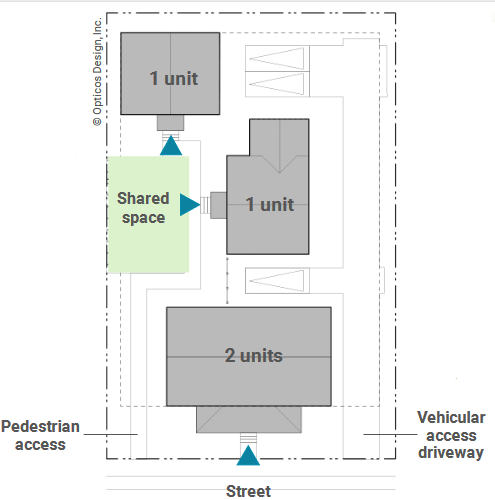
Now, for the lots that will mandate parking, if we are looking at what most likely is going to end up in your neighborhood, a duplex, triplex, fourplex or six-plex, that means they will be required to have two, three, four or six parking spaces respectively. For a duplex and even triplex, that’s not going to be more parking than a typical single-family home already has in many cases. And looking at the site plan above from Opticos Design, the parking spots can be easily hidden from street view. Fourplexes and six-plexes will be in a similar boat, where parking could potentially be hidden, or it may end up right off the street. And while that won’t be as nice to look at, think about how many houses have garages and driveways already at the front of the house. It won’t be out of place to have that much flatwork. Moreover, because of the required parking spaces, there isn’t likely going to be more vehicles parked on the street, as the households moving into the middle housing are typically smaller and therefore won’t have multiple cars.
Overall, the number of extra vehicles on the road is going to quite minimal taking all of the above into account. So there isn’t anything to worry about when it comes to cars.
Conclusion
If you are still thinking, “Well, who would even WANT to live in these?” Just remember that not every type of housing is for every person, but there is a market for every type of housing you could think of, whether it’s something you, personally, would want to live in or not. And with housing being as expensive and unaffordable to purchase these days as it is, there are many people who just want something they can afford and put equity into that meets their minimum needs. Which middle housing can do, while increasing many people’s quality of life. Middle housing a crucial step towards ensuring younger and older generations alike have reliable housing.
As housing-for-everyone advocates, TC Legend Homes and Powerhouse Designs strives to educate the public on these important issues while providing healthy, net-zero, carbon neutral budget homes in a effort to not only help the housing crisis, but provide top-performing homes.
To further discuss middle housing and the path forward for our community, or to get started on your very own project, contact us today!


Recent Comments